
Understanding MMT is important. The Fed has been following this policy for years.
The basic tenet of MMT is that governments shouldn’t worry about budget deficits.
MMT says we shouldn’t even think of income taxes as the government’s main source of revenue. It reasons that governments pay for the things they want by printing more money. (I’m not making this up.) Increasing taxes is just a way to cool an overheated economy.
According to MMT, a government can print as much money as it wants as long as there is “slack” in the economy. Slack means things like stable prices and less-than-full employment.
If any slack at all exists in the economy, the printing presses can keep on running.
A consequence of MMT – and printing more and more money – is something we’ve heard a lot about lately in the real world… inflation.
Inflation – Both Sides of the Argument
The following signs suggest we may be headed for a significant period of higher inflation:
- Concern about rising inflation in the next few years has been a topic of elevated discussion. Initially these anxieties were based simply on economic theory, but in 2021 they’ve been supported by empirical evidence:
- Used car prices rose dramatically because of shortages of imported parts.
- Home prices skyrocketed.
- Materials and component prices escalated: e.g., copper, lumber and semiconductors.
- Smartphones were in short supply.
- Shortages of labor in certain sectors have added to the threat of rising prices.
- The year-over-year increase in the Consumer Price Index was 4.2% in April, 5.0% in May and 5.4% in June. These are the highest readings since September 2008.
- Not only might higher prices for inputs (“cost-push” inflation) and more dollars chasing goods (“demand-pull” inflation) result in an excess of demand over supply and thus rising inflation, but excessive money printing might reduce the demand for U.S. dollars, cutting the currency’s value and causing the dollar prices of imports to the U.S. to rise.
- Particularly troubling in this regard is the recent tendency of those in Washington to spend trillions of dollars without identifying solid “pay-fors.” This has coincided with the rising influence of Modern Monetary Theory, which essentially says deficits and debt don’t matter. What if these ideas are ill-founded?
On the other hand, here are the arguments for why higher inflation might prove “transitory” (the word du jour).
- Many of the shortages affecting finished goods and manufacturing inputs – and the resultant price increases – can be seen as a natural consequence of restarting the economy and, especially, the global supply chain. It’s unrealistic to expect all parts of the global economy to immediately resume efficient functioning, and a lack of a single part can cause significant disruption, making it hard to manufacture finished goods. Since these factors result from the restart, they may prove ephemeral.
- It should be borne in mind that the prices of raw materials or finished goods aren’t solely determined by current economic developments in a direct, mechanical way, meaning prices aren’t necessarily “right” given prevailing conditions, any more than stock prices are always right. Rather, prices of goods are influenced by economic participants’ psyches and can easily overshoot or undershoot (just as in the stock market). As John Mauldin wrote in Federal Reserve Folly (July 23, 2021), “The rising prices that add up to inflation are the result of producer and consumer expectations for the future.” Thus prices aren’t just the result of supply and demand today, but also an indication of what people think prices will be in the future. We see this in the price of lumber, which rose by roughly 540% between the low in April 2020 – when no one thought there would ever be demand for new homes – and the high in May 2021 – when no one thought the supply of homes could ever meet the demand. Now the price of lumber is down by more than 60% in just the last two months, and we no longer hear much about its contribution to inflation.
- Clearly, a lot of the inflation seen in the first half of 2021 can be attributed to increased consumer spending financed by Covid-19 relief and the resultant bulge in savings and wealth. This should prove temporary: a given pool of extra dollars can’t produce elevated spending forever.
- The ending of enhanced unemployment benefits in September should bring more workers into the job market, reducing the impact of labor shortages on wages and thus the prices of goods.
- The growth of the economy will undoubtedly slow after 2021 or 2022, by which time the impact of 2020’s pent-up consumer demand will ebb significantly.
- There’s hope that the recent levels of stimulus, deficit spending and money printing will recede in the next few years (or at least their rate of growth will slow) as the economy continues to expand, meaning these factors will decline relative to the size of the economy.
- Technology, automation and globalization are likely to continue to have significant deflationary effects.
Global Monetary Policy Divergence
Monetary policy in the US, Europe and China is going different directions, and there are specific investment consequences every equity and bond investor should consider.
Key Points:
- US Federal Reserve officials are starting to signal a tapering of their asset purchases.
- The European Central Bank is signaling the opposite: that is won’t raise interest rates for 2-3 years and heavy asset purchases will continue.
- The People’s Bank of China is entering a new easing cycle as it tries to avoid repeating past policy whipsaws.
- A less accommodative Fed, along with a yield curve flatter than it normally is ahead of tighter policy, implies more upside for long-term Treasury yields.
- The ECB has no exit in sight and seems likely to keep yields low, though it may change its tools for doing so.
- Chinese bond yields should fall further when the PBOC begins cutting rates, likely within the next 12 months.
These policy divergences imply continued USD and renminbi strength, other things being equal… which, in this fast-changing environment, may not be the case.
The Delta Variant of COVID
This variant seems to be more transmissible and less deadly.
The Delta variant sweeping the nation is not only more contagious than previous mutations, it is also triggering different symptoms. In fact, there is one symptom that appears to indicate the new face of COVID-19.
At the beginning of the pandemic, experts noted that cough, shortness of breath, and loss of taste and smell were the predominant complaints for those infected with the virus. But things have changed with Delta.
“It seems like cough and loss of smell are less common,” said Dr. Inci Yildrim, a Yale pediatric infectious disease specialist and vaccinologist. She writes she isn’t surprised at the changes brought on by Delta, which the Centers for Disease Control and Prevention declare is as contagious as chicken pox.
“All viruses evolve over time and undergo changes as they spread and replicate,” she says. Yildrim adds that, based on the most current data available, the most common symptoms of Delta are headache, sore throat, runny nose, and fever.
Recent studies conducted in the U.K. by Kings College London as part of the COVID Symptom Study examined the new symptoms manifested by three groups of people who contracted the disease. One group was not vaccinated, the second was fully vaccinated and the third study group was partially vaccinated, according to Eat This, Not That!
“As we found, even people who had one or two doses of the vaccination can still be susceptible to contracting COVID, and the symptoms and severity differ depending on how many vaccinations you’ve had,” wrote the authors of the study.
But headaches remained the number one symptom in all three groups infected with the Delta variant, which is the most prevalent in the U.K. Also, cold symptoms which were not initially reported, are also on the rise among infected individuals, said researchers. Runny noses were the second most common symptom reported, followed by sneezing, in fully vaccinated people.
“If you have been vaccinated and start sneezing a lot without an explanation, you should get a COVID test, especially if you are living or working around people who are at greater risk from the disease,” said the researchers.
While loss of smell is now less common than during the initial phases of the pandemic, it’s still a tell-tale sign, ranking #5 among fully vaccinated people and #9 in those unvaccinated, according to Eat This, Not That!
Dr. Seema Bonney, founder and medical director of the Anti-Aging and Longevity Center of Philadelphia, tells Newsmax that there has been some worry over the spread of the Delta variant in recent weeks.
“In addition to being vaccinated and diligent with hand-washing, our best defense against COVID-19 variants and other viruses is a robust and healthy immune system,” she says. “A healthy immune system limits and can prevent infection.
“It acts as a barrier, protecting our body. The immune system is constantly surveying for infectious intruders, and when working optimally, will fight the infection. Simple lifestyle habits can keep your immune system healthy. These include daily exercise, good sleep hygiene, nutritious foods, adequate hydration and stress management.”
Zombie Companies
Zombies are companies that don’t earn enough profits to cover their interest – let alone repay their debt. They’re the walking dead, only kept alive by creditors willing to lend them more money to pay off their debt as it comes due.
Zombie companies are now at an all-time high. The current mark of 24% far eclipses the previous record of 16%. Take a look at how much it has surged in recent years.

Think about that… One out of every four companies is a zombie. They’re only alive today because the Fed has consistently lowered interest rates, allowing them to keep kicking the can down the road.
This is why we expect a wave of bankruptcies to sweep across the economy. You can see why even the mere mention of higher rates and a debt default can spook the markets big-time.
Jobs Report Last Friday
- Initial jobless claims are not budging, with the regular applications holding near 400k a week.
- When we look at the data without seasonal adjustments, claims are running just above 2012 levels.
- Morgan Stanley expects to see over a million net hires in July (similar to Oxford Economics).
- Small businesses report that the job market tightened further in July. The NFIB’s index of “job openings hard to fill” hit another record high.
- Companies are forced to pay more to attract workers. The percentage of small firms planning to boost compensation hit a record high.
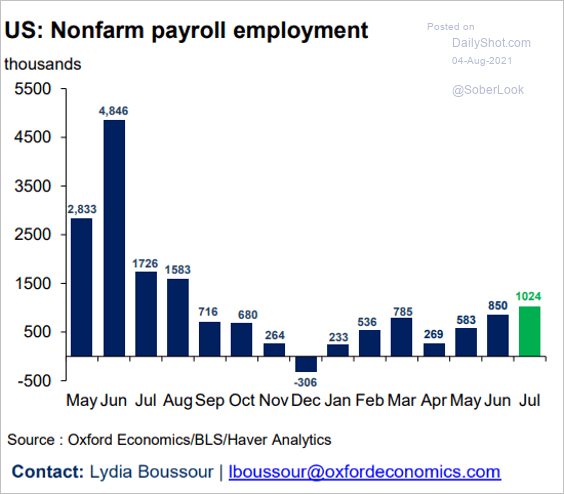
The US posted strong job growth in July according to this morning’s employment report. But as always, the devil is in the details.
Key Points:
- US payrolls grew 943,000 in July, driven by the leisure/hospitality sector and also local government, mainly education.
- The top line unemployment rate fell to 5.4% and the all-in U6 measure dropped to 9.2%.
- Average weekly earnings rose 0.4% in July and are now up 4.6% in the last year.
- The participation rate ticked only slightly higher, reflecting large numbers still staying out of the labor force.
- The US economy has now recovered 16.7 million of the 22.4 million jobs lost in March/April 2020.
- After a significant layoff cycle in March 2020, jobs are returning to normal. It is not a cycle of NEW job creation due to a booming economy, rather just the re-employment of those previously let go
Assuming the jobs picture improves further in August and September, we believe the Fed has run out of excuses for keeping QE at the current pace. Treasury yields rose after the report, so markets seem to agree. But the Fed has the final say. Over the past few weeks, Fed members have become much more vocal about the need to “taper” the current level of “Quantitative Easing.” Friday’s job report may accelerate that timeline.
For example, in a recent CNBC interview:
“Given this outlook, commencing policy normalization in 2023 would be entirely consistent with our new flexible average inflation targeting framework.’” – Richard Clarida
However, Dallas Fed President Richard Kaplan suggested that “tapering” could come even sooner.
“As we make substantial further progress, which I think will happen sooner than people expect, I think we’d be far better off, from a risk-management point of view, beginning to adjust these purchases of Treasuries and mortgage-backed securities.”
Inflation readings in the United States have shot up in recent months. Labor markets are extremely tight. In one recent survey, 46% of small-business owners said they could not find workers to fill open jobs, and a net 39% reported having increased their employees’ compensation. Yet, at the time of this writing, the yield on ten-year Treasury bonds is 1.24%, well below the ten-year breakeven inflation rate of 2.4%. At the same time, stock markets are flirting with all-time highs.
As he notes, something does not add up. With these current conditions, the Fed should tighten policy, reduce accommodation, and “reload their ammo” for the next downturn.
The chart below shows the Fed’s Monetary Decision Making Cycle.

If the Fed does try to reduce accommodation, the market will decline as liquidity gets drained from the system. As the market declines, consumer confidence falls, and the Fed becomes concerned about a weakening economic environment. Moreover, given the high amounts of leverage in the system, as asset prices fall, the risk of defaults and credit risk rise.
This cycle forces the Fed to bail out the major Wall Street banks to ensure that a credit event doesn’t take hold.

Since the “Financial Crisis,” total Government interventions surpassed $43 Trillion into the economy to keep it “afloat.” I say “afloat” rather than “growing” because, since 2008, the total cumulative growth of the economy is just $3.5 trillion. In other words, for each dollar of economic growth since 2008, it required $12 of monetary stimulus.
The diminishing rate of return on QE programs is becoming more evident. While increasing QE doesn’t increase economic activity, the removal immediately slows activity as individuals hoard savings. But, of course, that eventual outcome requires a return to more debt-funded policies to sustain low economic activity rates.
There are few good options.
As real yields in the US (and Europe) slump to new lows, Fed Chair Powell has been left scratching his head. Really? He should take a look at the ‘Hard Data’ chart below.
Real yields continue to collapse to new record negative lows, falling in the US below MINUS 1.2%. Chairman Powell was at a loss to explain the drivers behind this recent decline in yields, so attributed it to technical factors (always a cop-out when you have no idea) as he thinks the fundamentals remain strong.

Bonds continue to deliver an important message the Fed ignores, that the economy is slowing. Why stimulate an economy that’s doing so well, and run the risk of inflation? By maintaining its high level of accommodativeness, the Fed is showing that it’s more worried about economic sluggishness than about inflation.
Market Data
- The market is not concerned about tax policy risks. Goldman’s high-tax-rate names have been outperforming.
- The most-shorted stocks have been struggling as the Reddit crowd loses interest.
- “Reopening” stocks underperformed last week
- China has been in the news often as many of the Chinese companies are experiencing a crack down by the government on the “private” sector. We, of course know that there really isn’t a “private” sector in China as the government controls all. This has been a wake-up call for many investors who were holding many of these China-based companies.
How damaging has the government been to the Chinese market? The global markets chart below (available to subscribers) shows the continued long-term rising trends on all markets with the exception of China (FXI).

- Back in 1990, the five largest companies (by market cap) in the S&P 500 were oil company Exxon Mobil (XOM), cigarette maker Phillip Morris (PM), General Electric (GE), IBM (IBM), and Walmart (WMT).
Today, that same list has gone through a complete makeover. The five largest S&P 500 companies are all tech giants… Apple (AAPL), Microsoft (MSFT), Amazon (AMZN), Google/Alphabet (GOOGL), and Facebook (FB).
- Over the past 3 weeks, no energy stock has managed to close above its 50-day moving average. This is the 4th-longest streak of this kind of activity in the past 70 years.
- This week, we saw a continuation in disappointing economic reports. That has been more of a concern for bond and currency traders than equity investors. Our Macro Model is deteriorating, as is a breadth composite.
- According to research conducted by Ned Davis Research, Utilities, Energy and Financials are the S&P 500 sectors that have performed the worst, on average, in the final three months of all bull markets since 1970. As is clear in the chart below, these three sectors now are at or near the bottom in a ranking of trailing three-month returns.

- In contrast, according to Ned Davis Research, Consumer Staples, Health Care and Consumer Discretionary are the sectors that have performed the best, on average, over the three months prior to past bull-market tops. As the chart shows, these three have performed relatively well over the past three months.
US Economy
- The ISM Manufacturing PMI surprised to the downside. To be sure, factory activity remained robust last month, but the pace of growth has easesd from multi-year highs.
- Manufacturers increasingly see their customers’ inventories as too low.
- Input price growth remains near extremes.
- Hiring improved in July.
- The Citi Inflation Surprise Index hit another record high. Not good.

- Goldman’s financial conditions index shows extreme levels of accommodation.

- Residential and nonresidential construction spending trends continue to diverge.

- Public construction expenditures are still declining.
- The latest Homebase report does not show any improvement in small business employment between June and July.
- A separate report from Gusto shows small-business headcount improving faster for workers 25 and older in states that ended emergency unemployment benefits early.
- But job gains for workers 15-19 years old show the opposite trend.
- For the first time in over a year, hard economic surprises have come in well below economists’ expectations.
- June factory orders topped forecasts, hitting the highest level since 2014.
- The latest capital goods orders figures point to a substantial increase in business investment.
- And low inventories indicate further gains in investment going forward.
- US supply chain disruptions have been the most severe globally.
- According to CoreLogic, home price appreciation has peaked, and we should return to more sustainable growth over the next 12 months.
- The updated U. Michigan sentiment report shows that consumers are most negative on buying conditions for homes since the early 1980s.
- Rental housing demand is surging.
- Fewer tenants are moving out of apartments to buy a home.
- Where will we see the highest share of evictions once the moratorium ends?

- US automobile sales declined more than expected in July amid tight inventories and rising prices.
- Oxford Economics expects to see over a million new jobs created in July.
- Americans have become pessimistic about the coronavirus situation.

- The ISM Services PMI index hit a record high last month, pointing to rapid growth in the service sector.
- Hiring resumed after a pause in June.
- Price pressures show no signs of easing.
- The Fed continues to see inflation expectations as “well-anchored.”
- Wholesale used car prices have peaked, which will pull down the core goods CPI.
- More landlords are raising rents, which should boost the services CPI in the months ahead.
- The positive news from the ISM Services report was offset by soft ADP private employment data. According to ADP, the number of jobs created in July was less than half the level expected by economists.
- Mortgage applications for house purchase are holding at 2019 levels.
- Mortgage rates continue to drift lower.

- Hotel occupancy is at pre-pandemic levels.
- The nation’s trade deficit hit another record amid surging domestic demand.
Thought of the Week
It ain’t what you don’t know that gets you into trouble. It’s what you know for sure that just ain’t so. – Mark Twain
3 Pictures of the Week
Size of Africa


All content is the opinion of Brian J. Decker


