
The nonpartisan Congressional Budget Office is out with its estimate for President Biden’s Build Back Better Act. The $1.75T social spending measure is the second installment of the administration’s economic agenda after an infrastructure package passed earlier this week to update America’s roads, tunnels and bridges. Democrats hoped to pass the bill in the House on Thursday night, but an hours-long speech by Minority Leader Kevin McCarthy prompted them to postpone the vote until this morning.
CBO analysis: The federal agency found that the Build Back Better Act would contribute $367B to the deficit over 10 years, though that doesn’t include $207B in revenue which could result from spending $80B on tax enforcement efforts at the IRS. Adding in those potential gains, the bill’s 10-year deficit still totals $160B. The new figures added fresh impetus for Republicans to unite against the bill, with McCarthy calling it, “the single most reckless and irresponsible spending in the history of this country.”
On the other side of the aisle, the Biden administration said IRS spending would generate $480B (not $207B stated by the CBO), and would even reduce the total deficit by $112B over the next decade. That would mean the bill would be a net positive for the national debt and many Democrats appear willing to accept that perspective. Complicated matters is the support from centrists like Sen. Joe Manchin, who has flagged its hefty price tag, and only time will tell how things will play out. Democrats hope to pass the bill via a special legislative process called reconciliation, meaning the entire support of the party’s members would be needed in the evenly divided Senate.
What’s in the bill? Universal prekindergarten, capping child care expenses, negotiating lower prescription drug costs and expanding tax credits for reducing carbon emissions. It would also impose a new 15% minimum tax on large U.S.-based corporations, create a 1% tax on stock buybacks and raise taxes on U.S. companies’ foreign profits. However, the bill would leave the corporate tax rate at 21% after pressure from Sen. Kyrsten Sinema, while basic individual tax rates would stay unchanged for all but top earners.
“If the $4 trillion House spending bill passes, the U.S. will have the highest combined federal and state personal income tax rate in the developed world. Under the Democratic plan, the combined U.S. top rate would climb to 57.4% by 2026. The U.S. would leap over 22 other countries in the OECD tax ranking, including Italy (47.2%), Sweden (52.3%), and even France (55.4%). Germany comes in at a relative bargain at 47.2%. Congratulations, America, you’ll be Number One.” —Wall Street Journal
Risks to economic growth:

The debt ceiling jitters will return next month.

Farmers
Unless you are a farmer you probably don’t think much about fertilizers. Yet fertilizer is a critical input to the global food supply, and it threatens to keep food prices rising well into next year. This matters both economically and geopolitically.
- Mineral fertilizer is used for half the world’s food crops and its supply is extremely time-sensitive. Delayed or missed application results in lower yields, which tightens supply and drives prices higher.
- More than half of fertilizer supply is nitrogen, whose production is directly linked to natural gas prices.
- Nitrogen doesn’t linger in soil and must be re-applied each crop season. It is an unavoidable cost for farmers.
- Virus precautions and supply chain snarls have reduced fertilizer availability and raised prices worldwide.
- Farmers have other problems, including labor, pesticide and mechanical parts shortages.
- Government has limited capacity to solve these problems, which means farmers will keep bearing higher input costs. This will affect consumer prices.
We asked an Iowa farmer we know to read this analysis. He said it matches his experience. He luckily ordered fertilizer early but still can’t get herbicides. Recently he drove 200 miles to get an urgently-needed tractor part, and expects more such problems. That’s just one anecdote but such stories add up to the higher prices you see in the grocery store, and the inflation spreading to everything else.
Productivity Drops
Media stories about rising wages typically frame it as an expensive problem for employers. This isn’t necessarily true. Most employers happily pay more when they also receive more from the higher-paid workers. Higher productivity can justify spending more. Unfortunately, US labor productivity is going the other direction. The government measures this by comparing total output with the total number of hours worked. Simple division shows how much the average worker produces in an average hour. In Q3 2021, productivity in nonfarm businesses was an annualized -5% compared with Q2.

Meanwhile both hourly compensation and unit labor costs rose significantly. So this really is a dismal picture for employers. They are paying more and getting less. It’s no wonder some are in a foul mood.
Negative Yields
Here’s a look at inflation-adjusted long-term Treasury yields. The latest Consumer Price Index numbers put the 30-year bond yield well below zero, even using “Core” CPI which excludes food and energy prices. This means, assuming inflation stays at this level, bond purchasers are actually paying the US government interest.

That’s not as crazy as it sounds, though. For one thing, many bonds are being purchased by the Federal Reserve and will stay on its balance sheet a long time, maybe until maturity. For another, bond buyers who are US taxpayers may get a benefit on the back end, since the government’s lower borrowing costs may mean taxes are lower than they would otherwise be. But the important part here is at the other end of the chart. The last time we saw such negative real bond yields was in 1980. They didn’t last long because Paul Volcker was aggressively stamping out inflation. That is not the case today, so this odd situation may persist longer than expected.
Household Debt
The is the New York Fed’s quarterly household debt tracker. The interesting part is what you don’t see: any impact from the pandemic. Squint and you may notice a little flat stretch in early 2020, but then debt resumed rising at about the same pace it was before.

Many charts we show you have sharp, unmistakable COVID-driven divergences. But household debt—whether mortgage, auto, credit card, or student loans—has kept going steadily higher. There is one other notable point here, though. Mortgage debt, which retreated somewhat after the last recession, is now at a new high. Maybe all that debt people are taking on to buy expensive houses in a rising market will be sustainable. Or maybe not.
China
- Retail sales and industrial production reports have taken a big hit


- Home prices continue to decline.

- The US dollar rally is boosting the renminbi against other currencies. This trend will be a drag on China’s exports.
- State-owned enterprise (SOE) debt has grown to about 130% of GDP.

- Urban areas are facing labor shortages.
- China’s latest census has revealed poor demographics, with the working-age population shrinking more than expected.
US Economy
- The job openings report continues to point to a tight labor market in the US.
- The labor supply/demand gap remains unusually wide.
- The number of unemployed Americans per job opening hit a record low
- Americans are quitting their jobs in record numbers.


- What are the reasons many Americans are not urgently searching for a job?

- The U. Michigan consumer sentiment index deteriorated further, driven by inflation concerns.
- Households’ expected financial situation index has deteriorated sharply.

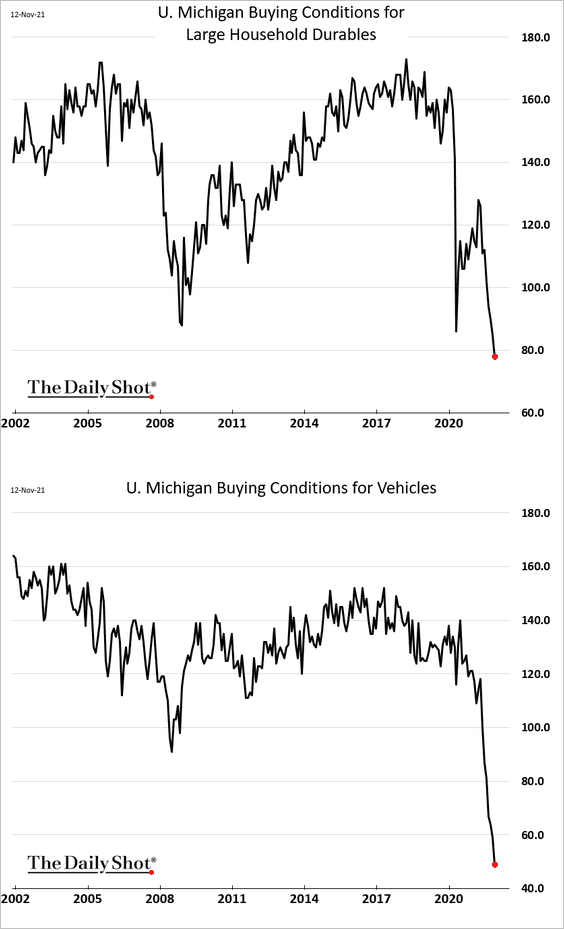
- Buying conditions for durables and vehicles have deteriorated further, driven by price concerns.
- US West Coast ports remain massively backed up.
- Finally, we have some data on the infrastructure bill.

- The NY Fed’s manufacturing report, the first regional survey of the month, showed a rebound in factory activity.
- Measures of supply bottlenecks appear to have peaked.
- But price indices show no signs of easing.
- The Evercore ISI apartment company survey shows an increasingly tight supply, which will be a tailwind for rent inflation.
- Economists continue to downgrade their GDP growth estimates for next year while boosting their inflation forecasts.
- Retail sales were well above expectations in October, with consumers starting their holiday shopping early (apparently unfazed by higher prices).
- Retailers and suppliers can’t keep up with demand
- For the first time in years, retailers have pricing power
- Despite the U. Michigan’s collapsing buying conditions index, spending on automobiles rebounded and remained well above the pre-COVID trend.
- Online spending is holding above the levels we saw in 2020.
- Industrial production also topped economists’ forecasts.
- Manufacturing output hit the highest level since early 2019.
- Vehicle production rebounded sharply.
- The NY Fed’s regional service-sector report continues to show rising price pressures and accelerating wage growth
- Job postings on Indeed are over 50% higher than they were just before the start of the pandemic.
- The U. Michigan sentiment indicator has deteriorated despite the labor market strength. The index tends to be more sensitive to inflation than other consumer gauges.
- The US dollar continues to strengthen, which should help ease import price inflation.
- Homebuilder sentiment is rebounding after the recent pullback as demand improves.
- Despite the complaints about high prices, the US demand for homes is exceptional.
- House rents are up sharply this year across all price categories.
- Commercial properties are rapidly being converted into residential space.
- Residential construction activity is moderating, especially in single-family housing.
- On a seasonally-adjusted basis, single-family starts are now below pre-covid levels.
- Shortages are creating a substantial construction backlog.
- Here is the number of residential construction projects that have been authorized but not started.

- The number of units currently under construction has exceeded the housing bubble peak.

- Investors accounted for a larger share of home buyers over the past year.

- Commercial warehouse construction spending has risen to all-time highs.
- Inventory rebuilding will support economic growth next year, according to Morgan Stanley.
- The Philly Fed’s regional manufacturing index rebounded this month as new orders surged
- Supply challenges worsened.
- And price pressures show no signs of easing. Manufacturers haven’t been boosting prices this rapidly in decades.
- In contrast to the Philly Fed’s report, the Kansas City Fed’s factory index eased, with new orders slowing sharply.
- The region’s supply bottlenecks are becoming more extreme.
- Companies are increasingly utilizing air cargo to speed up key deliveries as other modes of freight transportation become backed up. It’s an expensive way to move inventory.
- US initial jobless claims are back at pre-COVID levels.
- Continuing claims (which are reported with a one-week lag to initial claims) are also falling rapidly.
- Wholesale used car prices continue to surge.
Market Data
- YTD Commodity Returns

- Nuclear energy startups have raised $676 million in VC funding through the third quarter of this year, according to PitchBook data.
![]()
- Valuations point ahead to a “lost decade” in stocks.

- This chart shows the S&P 500 earnings estimates over the next few quarters.

- Small-caps have only outperformed large caps two out of the last eight months.
- Tech mega-caps are now 30% of the S&P 500 market cap.
When the %Stocks > 20/50-EMAs is less than the SCI percentage, there is a bearish short-term bias. You’ll note all of these indexes have short-term bearish biases moving into next week.
The NYSE, Nasdaq and OEX have less than 40% of their stocks with price > 20-EMA and these numbers are getting worse each day. The SCIs on all four of these indexes had negative crossovers their signal lines this week.
The NYSE has a differential between %Stocks > 50-EMA and the SCI of 29%. The SCI will likely accelerate its decline next week. Remember that EMAs move toward price. If price is above, they move higher. If price is below, they move lower. You cannot get an improved reading on the SCI when fewer stocks are above their 20/50-EMAs.

The Nasdaq has the weakest participation of the bunch with %Stocks > 20-EMA at a mere 35%.

The SPX is the only index with %Stocks > 20-EMA sitting above 40% and that is still very weak.

Thought of the Week
“Champions behave like champions before they are champions.
They have a winning standard of performance before they are winners.”
– Bill Walsh,
Former Head Coach of the San Francisco 49ers
Pictures of the Week


All content is the opinion of Brian J. Decker


